
In the EU the share of enterprises using AI grew from 7.7% in 2021 to 20.0% in 2025. Among those already using AI, marketing and sales is the most common purpose for smaller enterprises. What follows from this is not "put AI everywhere", but something more modest: the conversation with a customer is where AI arrives first, and it is worth testing on one page rather than across the whole site at once.
Source: Eurostat, dataset isoc_eb_ai, 2025 figures, EU-27. Enterprises with fewer than 10 employees are outside the survey
Data and practice
One source, one methodology, four observation points. No survey was carried out for 2022, so there is a gap in the series.
What this means: Over four years the share of enterprises using AI grew roughly threefold, and most of the change came in the last two years. This is not a one-season spike: the direction is the same across every size group.
What this data does not say: The indicator only shows that at least one AI technology is in use. It says nothing about how deeply it is embedded, nor about what it gave the company. The set of technologies in the questionnaire changed over the years, so what can properly be compared is the direction, not the exact level of each year.
| Indicator | 2021 | 2023 | 2024 | 2025 |
|---|---|---|---|---|
| Using at least one AI technology | 7.65% | 8.06% | 13.48% | 19.95% |
Population: Enterprises with 10 or more employees, all activities except agriculture, forestry, fishing, mining and the financial sector. Indicator E_AI_TANY, the use of at least one of the listed AI technologies. No survey was carried out for 2022, so the series has four points rather than five. The set of technologies in the questionnaire changed over the years, so the levels of individual years are only roughly comparable, while the direction of change is robust.
Source: Eurostat, dataset isoc_eb_ai. Data period: 2021, 2023, 2024, 2025. Geography: European Union, 27 countries. Data retrieved 2026-08-06
Data and practice
The same Eurostat data broken down by number of employees. 2021 and 2025 are shown so that both the level and the speed of change are visible.
What this means: The relative gap has narrowed slightly: in 2021 large companies were ahead of small ones by a factor of 4.6, and in 2025 by a factor of 3.2. In percentage points, though, the gap grew from 22 to 38. The practical meaning for a small company: catching up is not a matter of a percentage but of one specific process, and it is more sensible to start with the one closest to the money.
What this data does not say: This is all AI technologies at once rather than a chat on a website, and the data covers the EU only. The indicator says nothing about how deeply AI is embedded or what it achieved. What is comparable here is the direction and the structure of the gap, not the level in any one country.
| Indicator | 10 - 49 employees | 50 - 249 employees | 250 or more employees |
|---|---|---|---|
| 2021 | 6.12% | 12.55% | 28.41% |
| 2025 | 17% | 30.36% | 55.03% |
Population: Enterprises of the corresponding size, all activities except agriculture, forestry, fishing, mining and the financial sector. Indicator E_AI_TANY. Each group has its own denominator: this is a share within the group, not a share of all EU enterprises. The gap between the groups holds across every year of observation.
Source: Eurostat, dataset isoc_eb_ai. Data period: 2021 and 2025. Geography: European Union, 27 countries. Data retrieved 2026-08-06
Data and practice
The same Eurostat dataset with a different denominator: this is the share among enterprises that already use AI. The two outer size groups are shown so that the difference reads clearly.
What this means: For small enterprises marketing and sales is the most common use of AI: 34.1%, against 19.0% in production and 14.5% in ICT security. Large enterprises order it differently, with security and administration in front. Marketing and sales is the one purpose where the gap between the groups almost disappears: 37.9% against 34.1%.
What this data does not say: The shares are calculated against enterprises that use AI, not against all companies. Those users are about 20% of enterprises with 10 or more employees, so "34.1% apply AI in marketing and sales" does not mean that one company in three across the EU does so.
| Indicator | Marketing and sales | Production processes | Administration and management | ICT security |
|---|---|---|---|---|
| 250 or more employees | 37.89% | 33.46% | 43.38% | 47.51% |
| 10 - 49 employees | 34.06% | 19.02% | 28.49% | 14.51% |
Population: Enterprises of the corresponding size that use at least one AI technology, all activities except agriculture, forestry, fishing, mining and the financial sector. Unit PC_ENT_AI_TANY: the denominator is enterprises that already use AI, not every enterprise in the group. Indicators E_AI_PMS, E_AI_PPP, E_AI_PBAM and E_AI_PITS. The middle group of 50 - 249 employees is left out of the chart so that the contrast between the outer groups reads clearly and the groups do not overlap.
Source: Eurostat, dataset isoc_eb_ai. Data period: 2025. Geography: European Union, 27 countries. Data retrieved 2026-08-06
The data does not lead to "put AI everywhere". It leads to the fact that AI takes root first where the conversation with the customer happens. On a website that is the pricing page, a service page or an industry page, where people arrive with a question already formed.
Walk through the conversation as a visitor and ask the questions your site has no ready answer to. Anything you are not happy with is fixed before the first person sees the widget.
The number of conversations says nothing on its own. It is more useful to see what share of visitors started a conversation at all, and how many conversations reached a clear inquiry to a sales rep. Those are two different places to lose people, and they are fixed in different ways.
Any external percentages, including the ones above, are a reference point and not a promise of results. There is only one correct check: your site before and after a change, over comparable periods and with the counting method unchanged.
The numbers are taken from the primary source: the Eurostat API for the isoc_eb_ai dataset. No values were read off the diagrams in the reports. Each set sits in the site repository as a separate snapshot together with the date it was retrieved, the period, the geography, the unit of measurement and the list of transformations, so any figure on this page can be traced back to its source. A visitor's browser never contacts Eurostat: the page shows a local, verified snapshot.
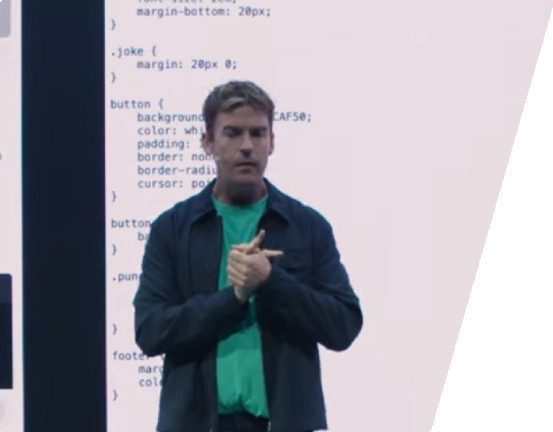
A person together with a machine is more effective than a machine, and a machine is more effective than a person working without one.
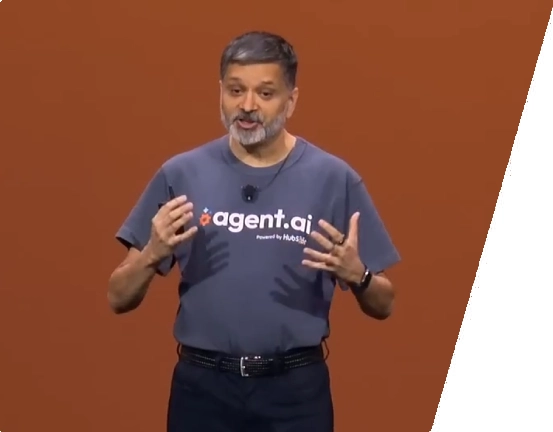
Personal communication between people, or between a person and a bot, is becoming the future of communications.
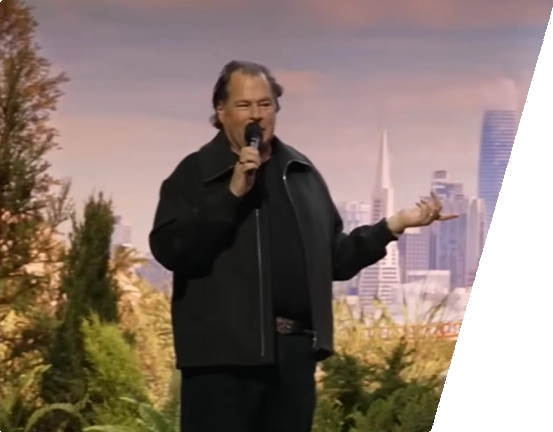
Generative AI may well be the most important technology of our time.
The price is calculated without registration, in the calculator on the pricing page

Set up the first conversation on the pages that matter: what to explain, which questions to ask, when to stay quiet and what to pass to your team.